


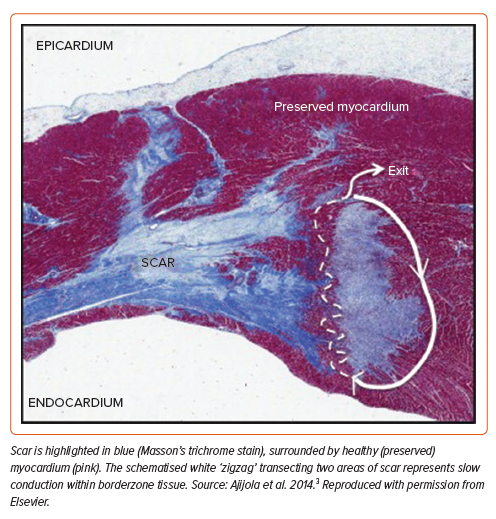
Catheter ablation of ventricular tachycardia (VT) reduces recurrence more favourably than drug therapy alone, with some studies demonstrating reduction in mortality.1,2 To guide successful ablation, accurate definition of the VT circuit construct is crucial. At its most basic level, the post-infarct re-entrant VT circuit is formed of three histologically distinct tissue types: healthy myocardium, scar, and borderzone (Figure 1).3 Scar – composed of fibrosed tissue – forms an immutable barrier blocking electrical conduction, while borderzone – composed of diseased but viable tissue within and surrounding scar – allows for channels of slow conduction and re-entry.4,5
Activation and entrainment mapping during sustained VT are the gold standards in defining the myocardial electro-architecture and resultant circuit. However, due to non-inducibility and haemodynamic instability, this is often not feasible. As a result, substrate mapping techniques have been developed, under the premise that surrogates of the VT circuitry can be predicted in a stable rhythm (sinus or paced rhythm).6 Substrate-based ablation is proven effective in reducing VT recurrence.7
Voltage mapping is an established approach to substrate ablation.6 This technique is underpinned by seminal studies from the early 2000s where scar and borderzone voltage properties were first defined.8 More recently, studies using high-density mapping catheters have demonstrated that historical voltage thresholds used to differentiate scar from borderzone may be inaccurate, with areas of slow conduction observed within traditionally-defined dense scar.9,10 To overcome this, electrophysiologists frequently adjust voltage threshold settings during VT ablation, although structured approaches have been lacking. As a result, voltage-independent mapping techniques have become increasingly prevalent.11
In this review, we discuss the principles underpinning traditional voltage mapping, before discussing the concept of dynamic voltage mapping (DVM), a structured and practical approach developed in our centre to help differentiate scar from borderzone tissue during VT ablation.
The Electrogram and Voltage Mapping
Cardiac myocytes are embedded in a network of collagen fibres and fibroblasts, crucial for maintaining the structural integrity of the myocardium. In the healthy heart, this network is composed of delicate weaves, facilitating direct contact between myocytes. In diseased states, fibroblast collagen synthesis is increased, resulting in diminished electrical coupling between myocytes and impaired propagation of the electrical impulse.12 Replacement fibrosis is a consequence of tissue injury and cell death, wherein collagen is deposited as a result of wound healing to preserve the structural integrity of the myocardium after death. As demonstrated in microscopy studies, different cardiomyopathic aetiologies result in different patterns of fibrosis, with varying landscapes of collagen-dense areas.13 Compact fibrosis consists of dense regions of fibrosis completely devoid of conductive tissue, serving as an anatomical barrier to conduction.13 Patchy fibrosis is typified by areas where collagen fibres and myocardial bundles intertwine, resulting in slowed conduction through the scar.13 In the post-infarct setting, De Bakker et al. first described a ‘zigzag’ course of activation along bundles of surviving myocytes, separated by collagenous septa; Ajijola et al. captured this elegantly in the histological slide shown in Figure 1.3,14,15
Electrograms (EGMs) recorded directly from the heart are generated by the depolarisation of cardiomyocytes that generate transmembrane currents.16 The amplitude of an EGM, measured in mV, is determined by the volume of tissue surrounding the recording electrode that activates at the same time. In healthy tissue, large areas will activate simultaneously, and the amplitude will be relatively large. In diseased myocardium, as myocardial fibres become increasingly separated, only small areas will activate at the same time, and the EGM amplitude decreases.
A bipolar EGM is obtained by subtracting two unipolar EGMs recorded at sites that are close together.16 Ventricular bipolar EGM characteristics were first described in the mid-1980s.17 These studies defined variables such as signal amplitude, duration, morphology and activation pattern.18–20 Subsequent studies identified areas of low amplitude and fractionated EGMs to be associated with prolonged dispersion of recovery and reduced excitability: conditions promoting re-entry.21,22 These studies led investigators to use bipolar EGM amplitude and morphology during sinus rhythm to identify channels of viable myocardium within dense scar representing isthmuses presumed to participate in re-entrant VT, with ablation lesions delivered perpendicular to or on the border of these channels presumed to lead to conduction block.8,23,24
The limitations of bipolar voltage for substrate mapping are well described.6 Notably, the amplitude of a bipolar EGM within the same location can vary dependent upon electrode tip size and inter-electrode spacing, electrode orientation in relation to the travelling wavefront and far-field annotation.25–27 More recently, omnipolar EGMs were generated to overcome these limitations, and are considered ‘wavefront independent’.28 Derived from a triangular clique of three adjacent electrodes on a grid-like catheter, advanced signal processing calculates EGMs at each clique in 360°, selecting the omnipolar EGM as that with the maximum voltage.
In ventricular endocardium, the traditional voltage cut-offs used to define normal and diseased myocardium date back to a seminal study by Marchlinski et al. from the early 2000s.8 Reference values were established in six patients without structural heart disease with a large-tip electrode catheter (4 mm tip electrode and a 2 mm ring electrode separated by 1-mm spacing). The mean bipolar EGM amplitude recorded from the left ventricle was 4.8 mV, with 95% of EGMs >1.55 mV. In the right ventricle, 95% of EGMs had an amplitude >1.44 mV. Using these data, the authors defined normal myocardium as that demonstrating an EGM of >1.50 mV. Based on their previous experience, they arbitrarily designated a value of <0.50 mV as consistent with ‘densely scarred’ endocardium.8 Voltages between these two values (0.50–1.50 mV) were classed as regions of slow conduction, termed ‘borderzone’.29 These values correlated reasonably with subsequent cardiac MRI and histological studies of myocardial scar.30–32
Recently, through multi-electrode catheter mapping studies with smaller electrode size and closer inter-electrode spacing, the traditional voltage definition of scar has been called into question. In a pig model, Tschabrunn et al. observed that 27% of EGMs with a voltage <0.50 mV showed distinct triphasic EGMs when mapped using a 1 mm multi-electrode catheter, compared with fractionated multicomponent EGMs recorded with a 3.5 mm electrode catheter.9 Further, in 2015, Berte et al. observed that 78% of patients undergoing VT ablation had areas of slow conduction within areas of bipolar voltage <0.50 mV.10 These findings suggest that EGMs recorded with small and closely spaced electrodes allow the identification of areas of preserved myocardial bundles within historically-defined dense scar. Previous studies provide examples of cases mapped concurrently with point-by-point and multi-electrode catheters, demonstrating smaller areas of dense scar with the latter.9
In modern practice, electrophysiologists frequently adjust voltage thresholds <0.50 mV to identify ‘true’ dense scar during VT ablation – a process sometimes referred to as ‘thresholding.’ Although little is published on this approach, in our experience it is generally performed arbitrarily, with some operators selecting fixed voltage cut-offs <0.50 mV (e.g. 0.20 or 0.30 mV), and others using varying cut-offs depending on patient characteristics or the visual appearance of the voltage map. This latter point raises an important concept: a blanket cut-off for all patients is unlikely to be accurate or meaningful as every patient is individual. Hence there is a clear need for an approach that identifies the individual voltage threshold, and thereby more accurately defines scar and borderzone, for each patient.
Dynamic Voltage Mapping
In order to improve the utility of traditional voltage mapping, our group has developed DVM, a practical technique enabling the identification of the optimal scar-borderzone voltage threshold.33,34 This approach involves simultaneously overlaying data from voltage and activation maps and ‘dynamically’ adjusting voltage thresholds in order to identify a patient-specific voltage threshold.
This technique has been developed and validated in two commercially-available electroanatomical mapping systems (CARTO 3 v.7 [Biosense Webster] and EnSite X [Abbott]).33,34 Both of these mapping systems offer algorithms that allow substrate activation maps to be superimposed and analysed on the surface of a voltage display. With CARTO, these activation maps are Ripple maps derived from bipolar EGMs, and with EnSite X these are activation vectors derived from omnipolar EGMs.
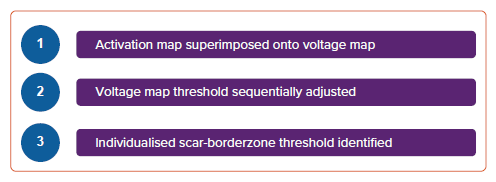
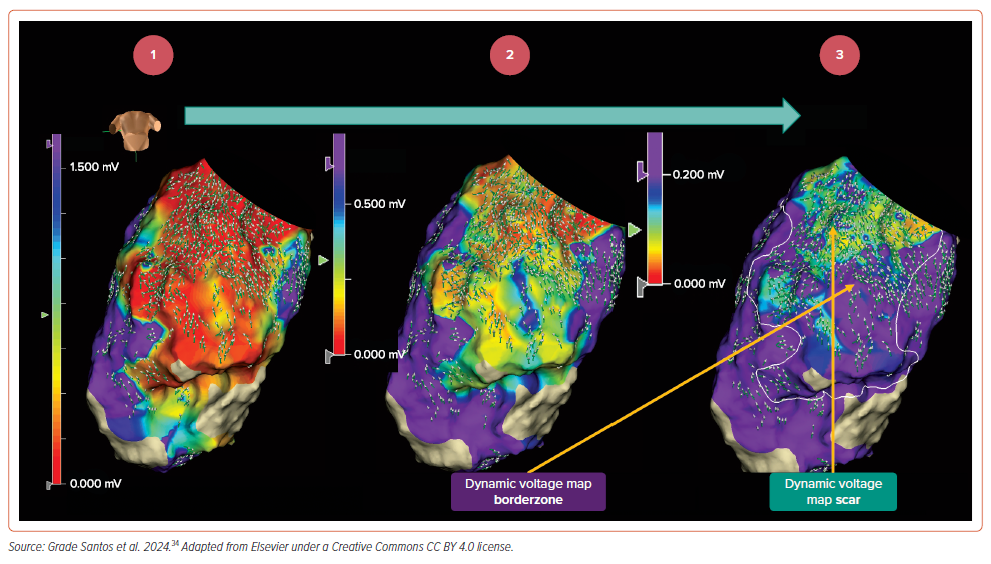
DVM is a three-step process (Figure 2), whereby:
- an activation map is superimposed onto a voltage display;
- the voltage map threshold is sequentially adjusted to highlight scar tissue; and
- a patient-specific scar-borderzone threshold is identified.
In the following sections, we describe the validation studies underpinning DVM and provide practical examples of this technique.
Dynamic Voltage Mapping in CARTO
We first developed DVM in CARTO in a cohort of 15 post-infarct patients undergoing high-density endocardial mapping of the left ventricle with a PENTARAY catheter (Biosense Webster).33
In CARTO, activation can be displayed using Ripple mapping. Ripple mapping is a technique that – rather than selecting and displaying a specific component of the EGM within a window of interest, as is the case in local activation time (LAT) mapping – displays EGMs in their entirety as dynamic bars protruding perpendicularly from the cardiac surface, with the height of each Ripple bar at any particular point in time being proportional to the EGM amplitude at that same time point.35 Ripple mapping overcomes a number of the disadvantages of LAT mapping, by allowing visualisation of myocardial activation without prior assignment of LATs, and without interpolation into unmapped regions.35 Ripple mapping is fully integrated into the CARTO platform and its utility has been demonstrated in both ventricular and atrial arrhythmias.36–38
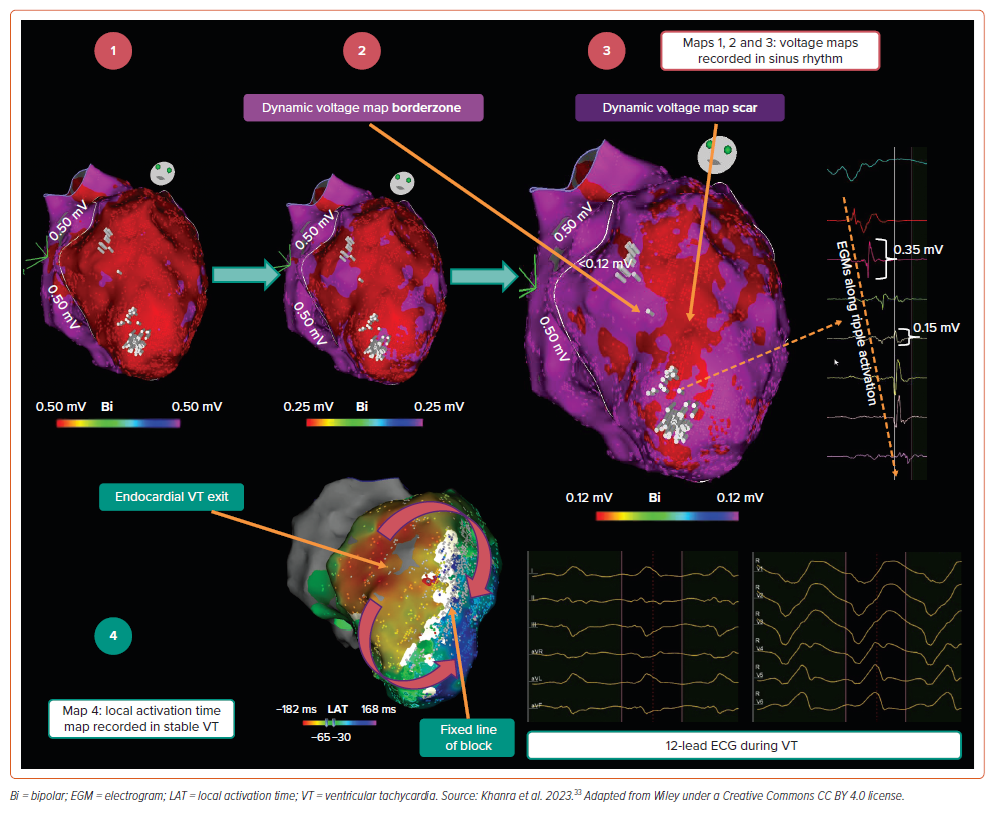
The concept of DVM was inspired by our observation that, when superimposing a Ripple map onto a voltage map, Ripple activation is frequently observed within areas of tissue bipolar voltage <0.50 mV. This is highlighted in the example provided in Figure 3 (Map 1), where the voltage threshold has been binarised to a value of 0.50 mV: on this map, red areas represent tissue <0.50 mV, and purple areas tissue >0.50 mV. This observation supported the notion of conduction within traditionally defined dense scar. By sequentially reducing the binarised voltage cut-off in 0.01 mV decrements (Figure 3, Map 2), we identified a voltage limit at which red areas were devoid of Ripple activation (Figure 3, Map 3). In the example provided, this voltage threshold was 0.12 mV, appreciably lower than the traditional 0.50 mV value. On the resultant map (Figure 3, Map 3), red areas represent true dense scar without conduction, and surrounding purple tissue represents borderzone. Stable VT was mapped (Figure 3, Map 4) and the dense scar was concordant between rhythms at 0.12 mV (i.e. the white ‘line of block’ in Map 4 was concordant with red dense scar area in Map 3; the VT circuit appeared to ‘exit’ on the septal side of the line of block, presumably taking a latent mid-myocardial epicardial course beneath the scar). Supplementary Video 1 provides a visual illustration of Ripple mapping and the DVM process in CARTO.
Following our initial observations, we formalised this approach into a three-step process:
- The Ripple map is superimposed onto the voltage map. Bipolar voltage limits are adjusted to a single value, to dichotomise tissue <0.50 mV in red, and >0.50 mV in purple. A design line is drawn around the tissue with voltages <0.50 mV.
- If Ripple bars are observed in red areas, the dichotomised voltage limit is sequentially reduced until no Ripple bars appear in red regions.
- Following this process, the identified voltage limit is termed the ‘DVM scar threshold’. Red regions are termed ‘DVM scar’ and purple regions within the design line are termed ‘DVM borderzone’.
We subsequently applied this approach to 15 patients undergoing VT ablation, through an offline analysis. Our primary findings were as follows:33
- The mean DVM scar threshold was 0.22 mV, significantly lower than the traditional 0.50 mV value.
- This threshold ranged widely between patients, from 0.12 to 0.35 mV, suggesting that individualised thresholds are required.
- The mean DVM scar area was significantly smaller than the traditional <0.50 mV area (respectively, 10.1 ± 8.1 cm2 versus 30.4 ± 16.3 cm2; p<0.001).
- In patients where stable VT was mapped, VT isthmus sites co-located within the DVM borderzone in all cases, as illustrated in Figure 3 (Map 4). Pace-mapping at the DVM borderzone matched the remaining unmappable VT morphologies.
Dynamic Voltage Mapping in EnSite X
Following our initial study in CARTO, we adapted the DVM technique to EnSite X in a cohort of 14 post-infarct patients undergoing high-density endocardial mapping of the left ventricle with an Advisor HD Grid Mapping Catheter (Abbott).34
In EnSite X, activation can be displayed using omnipolar activation vectors at any given location with an arrow. Omnipolar vectors depict the direction of the omnipolar EGMs within each triangular clique as that with the greatest amplitude in 360°. Although DVM scar can appear different on bipolar voltage maps when pacing from two different locations, omnipolar EGMs are considered wavefront independent and may better represent ventricular substrate.28,39
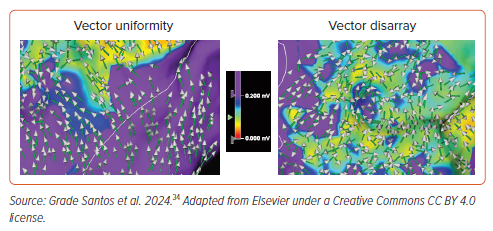
Through our derivation work, we observed that omnipolar activation vectors could, at any one time, appear uniform when pointing in the same direction, or chaotic when pointing in multiple unfathomable directions, a phenomenon we termed ‘vector disarray’.34 These two patterns are highlighted in Figure 4.
We adapted the three-step DVM approach to EnSite X, as follows:
- Omnipolar activation vectors are superimposed onto the voltage map (Figure 5, Map 1). Voltage limits are adjusted to a single value, to dichotomise tissue <0.50 mV in purple and >0.50 mV in non-purple (Figure 5, Map 2), and a design line is drawn around the tissue with voltages <0.50 mV.
- The dichotomised voltage limit is sequentially reduced until only non-purple areas contain omnipolar vector disarray (Figure 5, Map 3).
- Following this process, the identified voltage limit is termed the ‘DVM scar threshold’; in the example provided, this voltage threshold was 0.20 mV, again significantly lower than the traditional 0.50 mV value. Purple regions are termed ‘DVM scar’ and non-purple regions within the design line are termed ‘DVM borderzone’.
By applying this technique to 14 patients mapped with EnSite X, we found the following:34
- The mean DVM scar threshold was 0.27 mV, again significantly lower than the traditional 0.50 mV value.
- This threshold ranged widely between patients, from 0.18 to 0.50 mV, suggesting that individualised thresholds are required.
- The mean DVM scar area was significantly smaller than the traditional <0.50 mV area (respectively, 16.6 ± 10.9 cm2 versus 39.3 ± 22.9 cm2; p<0.001).
- In patients where stable VT was mapped, VT isthmus sites co-located within the DVM borderzone in all cases.
- There was good inter-observer agreement in DVM scar threshold measurement between two blinded observers.
- The distribution of clinically-delivered ablation lesions better co-located within and around DVM borderzone in patients who remained VT-free than in those with recurrence.
Dynamic Voltage Mapping: A Practical Technique to Differentiate Scar from Borderzone
Here we have described DVM as a novel approach to help delineate the post-infarct VT substrate. Superimposing activation maps on a voltage display allows rapid appreciation of wave-front interaction around low voltage tissue. Notably, this approach is feasible using two commercially available mapping systems and can be performed in three simple steps. As 3D mapping systems evolve, novel algorithms that allow activation to be played on a voltage surface may further the potential widespread application of DVM (as exemplified with CARTO 3 v.8 local conduction velocity vectors).40
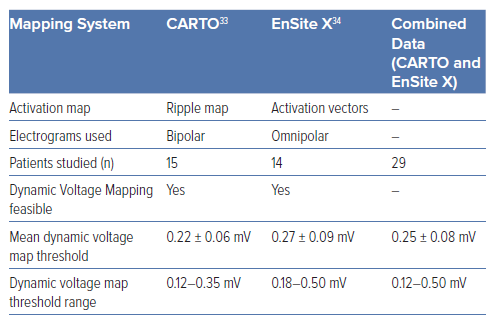
In Table 1, we summarise the commonalities of the approach between the two systems. Specifically, by pooling the data from both studies, we identify 0.25 mV as the mean voltage threshold differentiating scar from borderzone across patients in both studies. This value may be even lower if re-measured in future with even smaller electrodes using our technique. Indeed, a strength of our approach is that it is independent of electrode size and spacing and is therefore robust to new technologies. The DVM approach allows operators to determine individualised scar and VT circuit electro-architecture in a straightforward manner. Of note, across the 29 pooled cases, the mean scar area identified using the traditional 0.50 mV cut-off was 33.6 ± 19.2 cm2. In comparison, using DVM thresholds, only 46% of this area was deemed dense scar (15.4 ± 12.5 cm2). This suggests that DVM can be used to narrow down the area of scar during ablation. Importantly, in patients where stable VT was mapped (10 out of 29 cases), VT isthmus sites co-located within the DVM borderzone in all cases.33,34 In addition, pace-mapping at the DVM borderzone matched the remaining unmappable VT morphologies.33,34
We feel that voltage thresholds must be individualised as they are dependent on the individualised scar construct (tissue thickness, peri-infarct perfusion time and proximity to far-field healthy tissue).41 Whether our assessment of borderzone and scar tissue remains concordant if studied from multiple wavefronts requires further study – it was notable that DVM scar appeared fixed when occasionally remapped using omnipolar EGMs in different paced wavefront.
Scars associated with non-ischaemic cardiomyopathy have yet to be studied using the DVM technique, although may pose certain challenges that require further study. Unlike post-infarct scars, non-ischaemic scars can be mid-myocardial/epicardial with more patchy low voltage distribution and fewer fixed boundaries.42
Finally, our retrospective studies suggest that targeted ablation of DVM borderzone may be effective at reducing future VT, although this requires prospective validation. At our institution, we are currently setting up a prospective study to assess this further.
Conclusion
Voltage mapping remains a vital tool in the armamentarium of the electrophysiologist during VT ablation. Traditional scar-borderzone voltage thresholds – derived over two decades ago – have become outdated in the era of high-resolution mapping catheters. DVM, through simultaneous display of activation and voltage maps and sequential adjustment of voltage map properties, allows for improved scar-borderzone characterisation and individualised definition of the optimal voltage threshold. This technique is feasible across different mapping platforms and may prove a helpful adjunct when other substrate mapping techniques are less forthcoming.
Clinical Perspective
- Traditional voltage thresholds used to define ventricular scar (<0.50 mV) and borderzone (0.50–1.50 mV) are of unclear utility in the era of high-resolution mapping.
- Dynamic Voltage Mapping is a practical technique feasible across 3D mapping platforms, where activation is superimposed on a voltage map, to enable an alternative definition of these voltage thresholds.
- Using Dynamic Voltage Mapping, the mean voltage threshold defining dense scar may be substantially lower than the traditional 0.50 mV cut-off.
- Scar and borderzone voltage thresholds vary considerably between patients, suggesting these thresholds should not be generalised, but individualised per scar construct.